Bookmarks
Bookmarks
Tag cloud
Picture wall
Daily
RSS Feed
Login
Remember me
Picture Wall - 11 pics
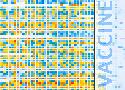
Battling Infectious Diseases in the 20th Century: The Impact of Vaccines - WSJ.com
Facebook Timeline — Countering Crime
Incarceration in Real Numbers
15 Best WordPress Plugins for Data Visualization - WPExplorer
INFOGRAPHIC: A world of languages - and how many speak them | South China Morning Post
The Conversation Prism by Brian Solis and JESS3
Snake Oil? The scientific evidence for health supplements
Data Visualization and Business Intelligence from Tableau Software | Tableau Software
Visualizing 6 Years of Facebook [INFOGRAPHIC]
Information Is Beautiful | Ideas, issues, concepts, subjects - visualized!
25 Graph and Chart Solutions for Web Developers : Speckyboy Design Magazine
Fold
Fold all
Expand
Expand all
Are you sure you want to delete this link?
Are you sure you want to delete this tag?
The personal, minimalist, super fast, database-free, bookmarking service by the Shaarli community